What we can expect over the next couple of weeks with COVID-19
I understand that many people doubt that COVID-19 is as serious as the media is making out. That it is a beat up. I thought it is worth going through a few facts. Predictions I wrote in my My last post are coming true.
At my time of writing now (7:30 am Tuesday 24 March 2020), Australia has 1,717 known cases of COVID-19, 11 in intensive care and 7 deaths.
These reported numbers become complicated by a few factors
- Medical advice is that it takes about 10-14 days for people infected with COVID-19 to show symptoms sufficient to identify as needing testing.
- Chinese research showed that even their robust testing found only 14% of those infected.
- We don’t have enough test kits. Because of that, we don’t test enough people and so don’t know how many are actually infected.
- Tests take too long to provide a result. So, infected people get to infect quite a few more before we ‘know’ of their infection.
We have a large number of people in our community who unknowingly have COVID-19 and can and do wander around infecting more people.

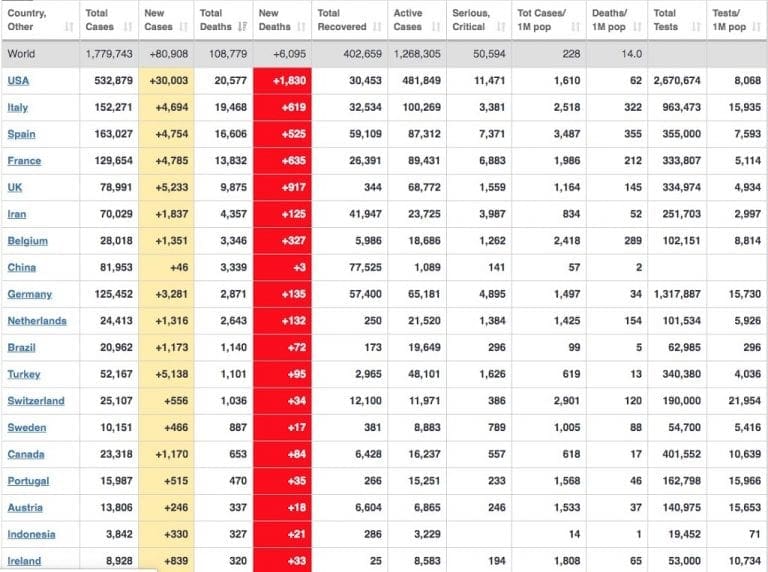
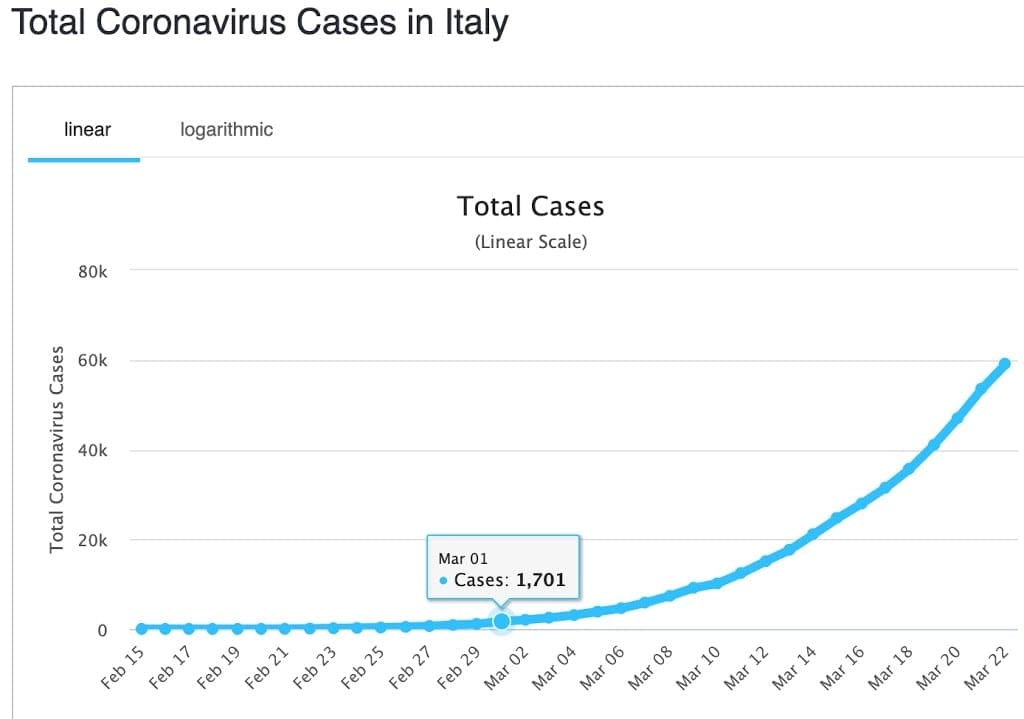
I’m going to talk through a few graphs and tables. I keep comparing Australia with what has happened in Italy and France – both countries with medical/health systems that you might imagine could cope. The graph above shows that on 1 March, Italy had 1,710 known cases of COVID-19 (compared with our 1,717 as of today) and 41 deaths. Just 22 days later, Italy now has almost 64,000 identified infected, 3,204 in intensive care or on ventilators and 6,077 deaths – that includes many medical people. Italy is overwhelmed.

The graph above shows that on 10 March, France has 1,784 known cases of COVID-19 (compared with our 1,717 as of today) and 33 deaths. Just 12 days later, France has almost 20,000 identify cases, 2,082 in intensive care/ventilators and 860 deaths. France is close to being overwhelmed.
You could argue that Australia has fewer deaths (just 7). So we are on a different curve. I hope so. On 12 March, Germany had just 6 deaths. Just 10 days later, Germany has 94 deaths. It looks as though Germany has done a few things that work in slowing down COVID-19. I hear politicians for all countries (including ours) stating ‘we are the best in the world’. Yes, we are all the best in the world.

The table above is complex, but worth a study. The columns need to be explained. ‘France Date’ = the day this data was recorded for France. ‘Days Oz Lag’ = my estimate of the number of days Australia is lagging France. ‘Expect Australia Date’ = my estimate of the date that Australia will have the same data that France had earlier. ‘Infected’ = number of identified COVID-19 cases. ‘Active’ = number of those infected that have not been ‘resolved’. ‘Mild’ = an ‘active case’ with a mild infection. All percentages are a percent of ‘Infected’. ‘Severe’ = number of cases in intensive care or on ventilators. ‘Mild’ and ‘Severe’ are all ‘Active’ cases. ‘Recovered’ = the number (and percentage) that have been classified as completely recovered. ‘Dead’ = dead. ‘Recovered’ and ‘Dead’ combined are the cases that are ‘resolved’.
For example, on 15 March, France had 5,423 infected, 5,284 of who were still Active cases, 4,884 were classed as mild, 400 as severe, 12 had recovered and 127 were dead. I predict that Australia will probably have those numbers on about 28 March. Read down and notice the rapid increase in cases in ‘Severe’ (400 to 2,082 in just 8 days) and ‘Dead’ (127 to 880 in just 8 days). Historic data for Severe and Recovered are difficult to get. I just happen to have kept those few data shown.

The Italy table is similar. For example, on 15 March, Italy had 24,747 infected, of which 20,803 were still active cases, of which 18,931 were classed as mild, 1,672 as severe, 2,335 were classed as recovered and 1,809 were dead from COVID-19. By my estimate, Australia will have those numbers on 5 April.
Looking down that table, notice the rapid increase in severe cases (needing intensive beds or ventilators) (from 1,672 to 3,294 in 8 days) and dead (from 1,809 to 6,077 in just 8 days). Also notice that the estimates from France and Italy do not neatly line up. There is a 1,000 difference in my estimate for number of dead on 5 April. I’m sure that difference will work itself out over the next week. I think France might be on a slightly flatter curve. Also, compare the percentage of dead between Italy and France.
I hope we are following a curve closer to Germany – which unfortunately I have not tracked. It is difficult to get historic data for severe and recovered. We will see.
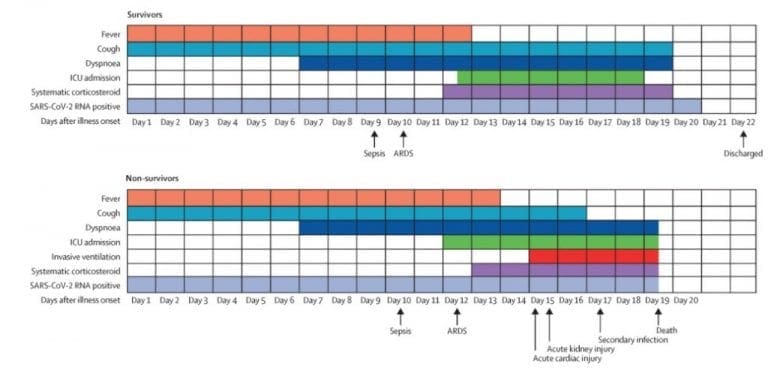
It is worth looking through the percentages. I know that some parts of social media are reporting that most people ‘only have a mild infection’. True. However, look at the very small percentages that are classed as ‘recovered. ‘Mild’ cases are still ‘Active’ and appear to ‘progress’ to ‘severe cases’ (where they overwhelm ICUs) or ‘Dead’.
BTW, those people in the ‘severe’ columns, they are now in intensive care. Their path from ICU is either to death or a long and difficult recovery because their lungs have been partially destroyed by their infection and subsequent pneumonia. They may never be able to function or live as they did before their infection.
We know from reports from all countries with more than about 1,000 in ‘severe’ that smaller ICUs are quickly overwhelmed and triage very soon ensures that older people (or people without dependants, prisoners, wrong colour, sex or other arbitrary categories) are very quickly classified as ‘black tag’ – not worth saving – ‘do not treat’ except maybe palliative care.
We don’t have enough staff with ICU training to look after those people in ICU. Nor do we have enough Personal Protective Equipment for those staff. So, the few ICU staff we do have also become infected and die. Exacerbating the problem.
What to do?
My last post ‘Australia needs to lock down now. Close shops. Restrict people to their residences. Introduce methods of early testing. We must slow this down before we are overwhelmed.’
Stay inside. We can see that full isolation works – so isolate yourself. Do not go out except for food, medical. Do not meet or allow into you home anyone who does not live with you. Do not be in a group larger than 2 – and then 2 metres away. Else, you will soon become a number in one of my tables. This is what we mean by ‘slow it down’.